Comparative Study of Deep Learning Methods for Rice Leaf Disease Detection
Download PDFRice is a staple crop for millions of people worldwide and a cornerstone of Vietnam's agricultural economy. This paper presents a comprehensive comparative evaluation of YOLOv8, Faster R-CNN, and SSD for automated rice leaf disease detection on a unified dataset of 8,040 annotated images covering four disease classes from Vietnamese rice paddies. YOLOv8 achieves the best overall balance with mAP@50-95 of 0.732 and inference speed of 1,873 FPS.
Introduction
Vietnam is among the world's top three rice-exporting nations, cultivating approximately 7.5 million hectares and producing 40-45 million tons per year. Four major diseases threaten yields:
- Bacterial Blight (Xanthomonas oryzae) — 20-50% yield loss
- Blast (Magnaporthe oryzae) — epidemic-level damage in Northern Vietnam
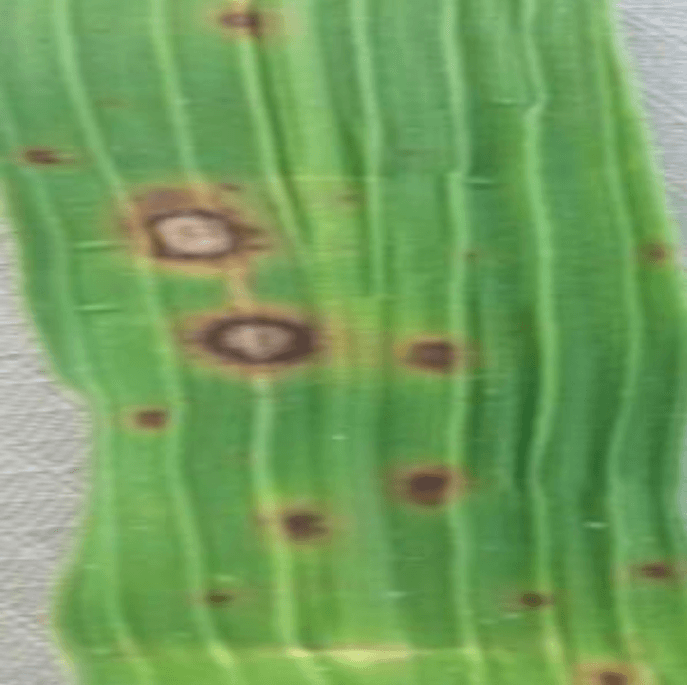
- Brown Spot (Cochliobolus miyabeanus) — degrades grain quality
- Twisted Draft / Tungro (SRBSDV) — stunting and leaf curling in Mekong Delta
Conventional manual inspection is labor-intensive and often too late. Deep learning offers automated, rapid, objective detection.
Methodology
Three architectures evaluated on the same dataset:
YOLOv8
Single-stage, anchor-free, CSPDarknet backbone. Single forward pass. Loss: CIoU + BCE + DFL. Trained 100 epochs on NVIDIA A100, ~16 min.
Faster R-CNN
Two-stage, ResNet-50 FPN backbone. RPN generates 15 anchors/position. RoI Pooling to classification head. Trained 50 epochs on L4 GPU, ~1.5 hr.
SSD512
Single-stage, ResNet-50 backbone. 6 feature map levels, 16,512 anchors. Trained 250 epochs on L4 GPU, ~2 hr.
Dataset
| Split | Images | BBoxes | Percentage |
|---|---|---|---|
| Train | 6,622 | 5,958 | 82.4% |
| Validation | 946 | 1,372 | 11.8% |
| Test | 472 | 472 | 5.8% |
| Total | 8,040 | 7,802 | 100% |
Class Distribution
| Disease Class | BBoxes | Proportion |
|---|---|---|
| Bacterial Blight | 1,489 | 25.4% |
| Blast | 1,191 | 20.3% |
| Brown Spot | 1,598 | 27.3% |
| Twisted Draft | 1,524 | 26.0% |
Results
Model Comparison
| Model | Precision | Recall | F1 | mAP@50 | mAP@50-95 | FPS |
|---|---|---|---|---|---|---|
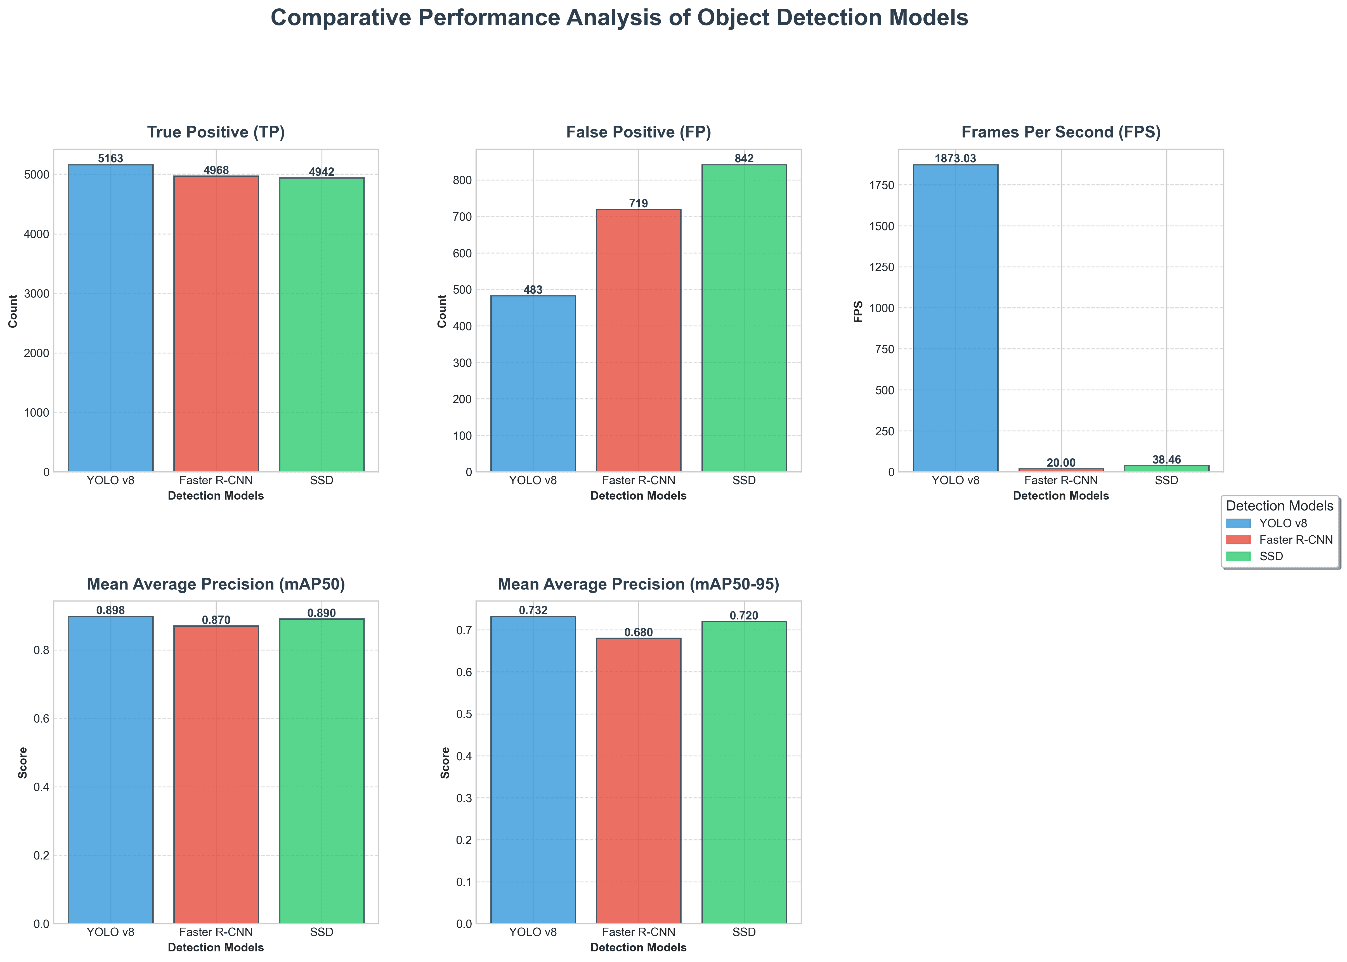
| YOLOv8 | 0.923 | 0.858 | 0.889 | 0.898 | 0.732 | 1,873 |
| Faster R-CNN | 0.880 | 0.850 | 0.865 | 0.870 | 0.680 | 20 |
| SSD | 0.850 | 0.800 | 0.824 | 0.890 | 0.720 | 38.5 |
ROI Size Impact
| Disease | ROI Size | YOLOv8 mAP@50 | FRCNN mAP@50 | SSD mAP@50 | Avg FP |
|---|---|---|---|---|---|
| Brown Spot | Large | 0.957 | 0.920 | 0.900 | 127 |
| Bacterial Blight | Medium | 0.910 | 0.900 | 0.880 | 160 |
| Blast | Medium | 0.949 | 0.880 | 0.860 | 136 |
| Twisted Draft | Small | 0.770 | 0.750 | 0.780 | 258 |
Discussion
ROI Size Impact
Twisted Draft consistently lowest across all models (mAP@50 0.750-0.780) due to small lesion areas <0.2x0.2 pixels after backbone downsampling. False positives highest: 221-286 vs 67-128 for other classes.
Speed-Accuracy Trade-off
- YOLOv8: optimal for real-time (mobile, drone) — 1,873 FPS, 3.2M params (6.3MB)
- SSD: middle ground — 38.5 FPS, competitive mAP@50
- Faster R-CNN: best for lab analysis — highest IoU (0.71), too slow for real-time (20 FPS)
Deployment Scenarios
- Mobile app: YOLOv8 (under 80ms on CPU, on-device without connectivity)
- Drone field scanning: YOLOv8 or SSD
- Lab analysis: Faster R-CNN
Conclusion
Key Findings
- YOLOv8 optimal overall: highest mAP@50-95 (0.732), Precision (0.923), F1 (0.889), speed (1,873 FPS), lowest FP (483)
- SSD: highest mAP@50 (0.890), near-real-time at 38.5 FPS
- Faster R-CNN: best localization (IoU 0.71), unsuitable for real-time at 20 FPS
- Twisted Draft unsolved — small ROI challenge remains
Future Directions
Small-ROI optimization (16x16 anchors + FPN attention), DETR/RT-DETR architectures, dataset expansion (+500-1,000 Twisted Draft images), INT8 quantization for Jetson Nano, IoT integration with environmental sensors, instance segmentation (Mask R-CNN / U-Net).